Energy Timeline
The Energy Timeline visualises the history of the network process. It provides a basis for discussion about the process, insights which emerged from it, and how the network may wish to move forward. The defining feature of this method is the focus on energy.
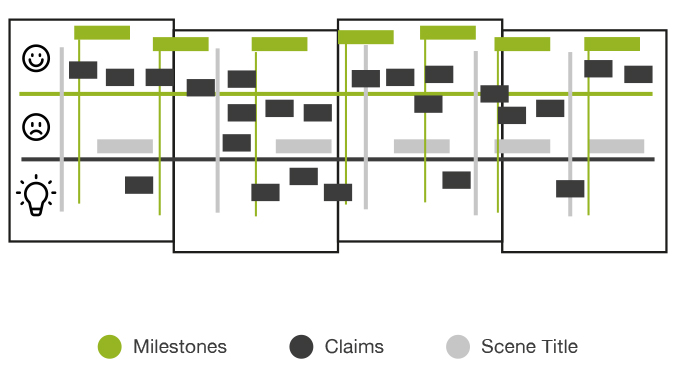
Ingredients: flip-charts positioned next to each other in a line
- Top row (smiley face): moments that gave energy
- Middle row (sad face): moments that drained energy
- Bottom row (lightbulb): breakthrough moments and insights
 Souhaitez-vous ajouter le site web à l'écran d'accueil ?